Beginning in January 2014, the trajectory of median new home sale prices in the U.S. with respect to median household income began to follow a new trend, with typical new home sale prices increasing at an average pace of nearly $11 for every $1 increase in typical household incomes.
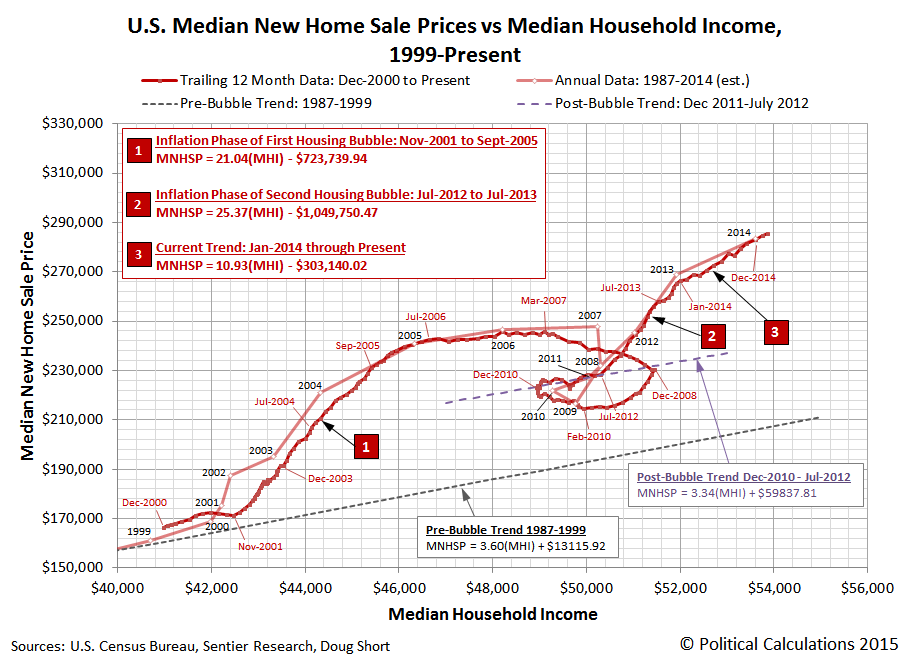
The good news is that rate of increase is less than half that observed during the primary inflation phases of the first and second housing bubbles in the U.S. The bad news is that rate of increase with respect to household incomes is still 2.7-3.3 times greater than those recorded during periods of stable growth in the periods preceding the inflation phases of real estate bubbles.
As we noted in our previous installment, the current pace of growth is consistent with that observed in the latter portion of the inflation of the first housing bubble.
Now, it’s important to note that this situation doesn’t mean that a new crash in housing prices is imminent, or even likely. Now that real estate investors have established a shortage of affordably-priced homes in the U.S. market, U.S. homebuilders are now better able to exploit the situation by building more affordably-priced homes, which several have begun to do in recent months.
Note to America’s builders: less-expensive homes are starting to move.
Purchases of new homes climbed 7.8 percent from the previous month to a seasonally adjusted 539,000 annualized pace in February, a seven-year high, according to the latest U.S. government report. Perhaps the best news for the housing industry as a whole came in the breakdown of sales, by price.
Americans signed contracts to purchase 17,000 new houses in the $200,000-to-$299,999 price range last month, the most since March 2008. That amounts to 39 percent of the 44,000 properties sold in February (unadjusted and not annualized). Another 8,000 homes—the most in nine months—sold in the range of $150,000 to $199,999.
The shifting sales mix of new homes toward lower priced homes is prompting an increase in sales volumes, which is a desirable outcome for the current market. Since November 2014, when the median new home sale price in the U.S. peaked at $302,700, the median sale prices of new homes has fallen in each month since, and in February 2015, stands at a preliminary value of $275,500. This figure will be revised several times over the next several months.
The wild card in this situation is the state of the U.S. economy, where a number of leading and real-time indicators suggest has entered a period of contraction, particularly in states that have boomed in recent years with greatly increased oil and natural gas production. If that contraction expands significantly beyond these states or if it increases in severity, home prices could be negatively impacted.
References
Sentier Research. Household Income Trends: February 2015. [PDF Document]. Accessed 5 April 2015. [Note: We have converted all the older inflation-adjusted values presented in this source to be in terms of their original, nominal values (a.k.a. “current U.S. dollars”) for use in our charts, which means that we have a true apples-to-apples basis for pairing this data with the median new home sale price data reported by the U.S. Census Bureau.]
U.S. Census Bureau. Median and Average Sales Prices of New Homes Sold in the United States. [Excel Spreadsheet]. Accessed 5 April 2015.