We don’t normally follow the Dow Industrials index (NYSE: DJI), since it really doesn’t capture enough of the breadth of the U.S. stock market, but last Friday, 7 August 2015 saw a pretty rare occurrence, with the Dow having closed lower than the previous day for the seventh consecutive trading day in a row.
While the S&P 500 fared slightly better by that measure over that same period of time, declining in only six of the same seven days, we wondered what its worst streaks were over its entire history.
To find out, we tapped Yahoo! Finance’s S&P 500 historical price database and ran the numbers. The chart below reveals the number and duration of two or more consecutively down days that the index has recorded over the 16,506 trading days from 4 January 1950 through 7 August 2015.
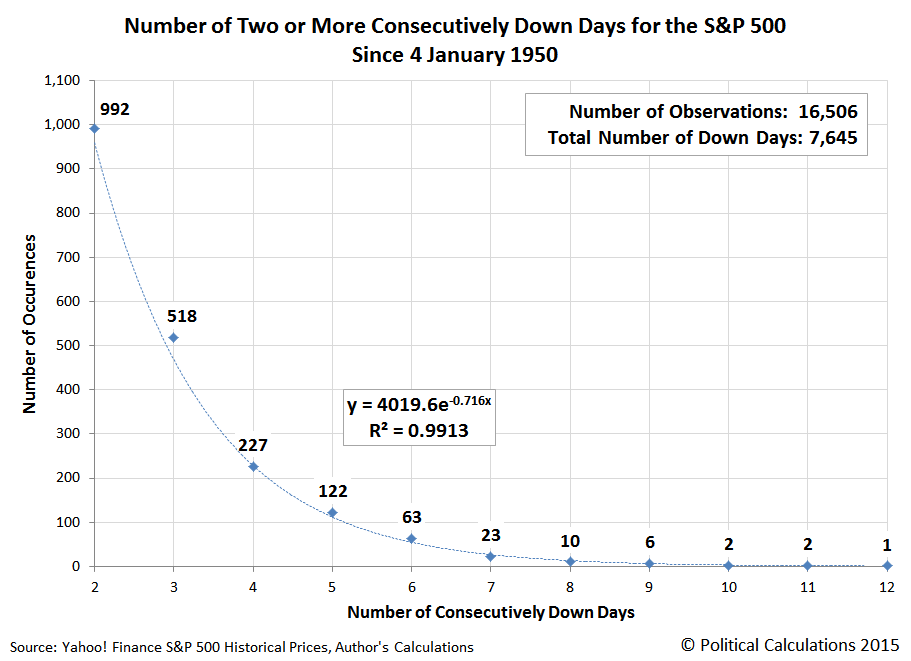
Since 4 January 1950, we see that the S&P 500 has had losing streaks run seven tradings days or longer some 44 times, with 23 of those streaks lasting exactly seven days before the index recorded an up day to break its losing streak.
The longest losing streak recorded over this period of time lasted twelve consecutive trading days, which began after it peaked on 21 April 1966 and lasted through 9 May 1966.
The timing of that longest losing streak roughly corresponds to the fallout from the Fed’s decision on 12 April 1966 to begin “‘restricting’ rather than ‘moderating’ the growth in the reserve base, bank credit, and the money supply” available to the U.S. financial system, inaugurating a prolonged period of increased distress for the U.S. economy. That distress was indicated by the reversing momentum of the S&P 500 index, where it coasted on its previous upward inertia to top at 92.42 on 21 April 1966, after which it entered into a general period of decline until it finally bottomed at 73.20 on 7 October 1966, some 20.7% below its previous peak level. It would not recover to that former peak until 27 April 1967.
Unless there is significant erosion in the expectations for future dividends or a significant negative noise event, that kind of decline is unlikely to occur in today’s market, but the general trend our rebaselined model of how stock prices work currently forecasts is such that the remainder of August 2015 would appear to be set to follow a downward trajectory.
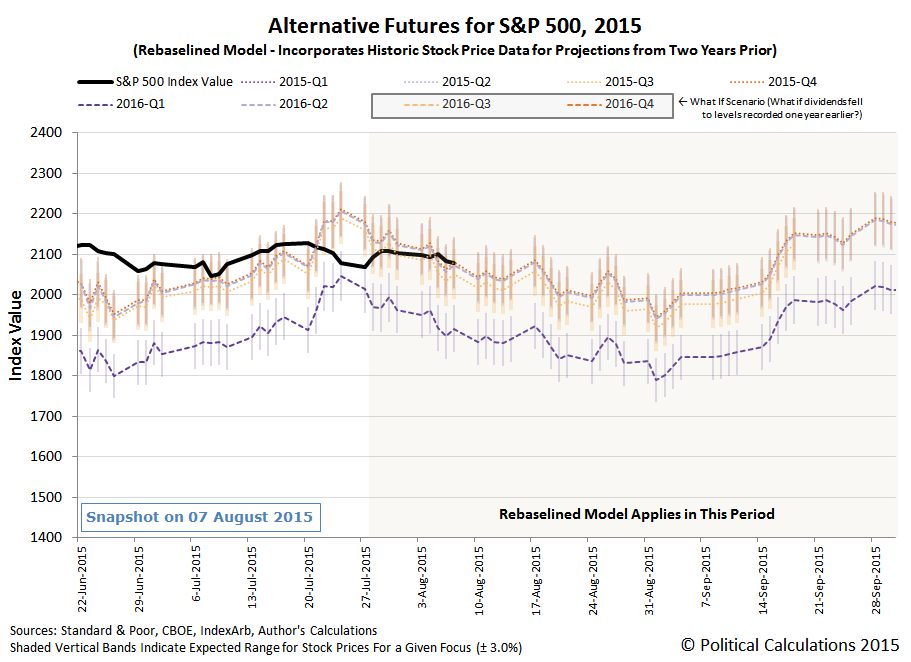
Things would appear set to improve in September 2015, with the biggest boost coinciding with the timing of the Federal Reserve’s Open Market Committee meeting in the middle of that month, but our limited ability to peer into the farther future suggests that would provide only a short term boost, as 2015 on the whole would appear to be set to be best described as a year of relative stagnation for U.S. stock prices.