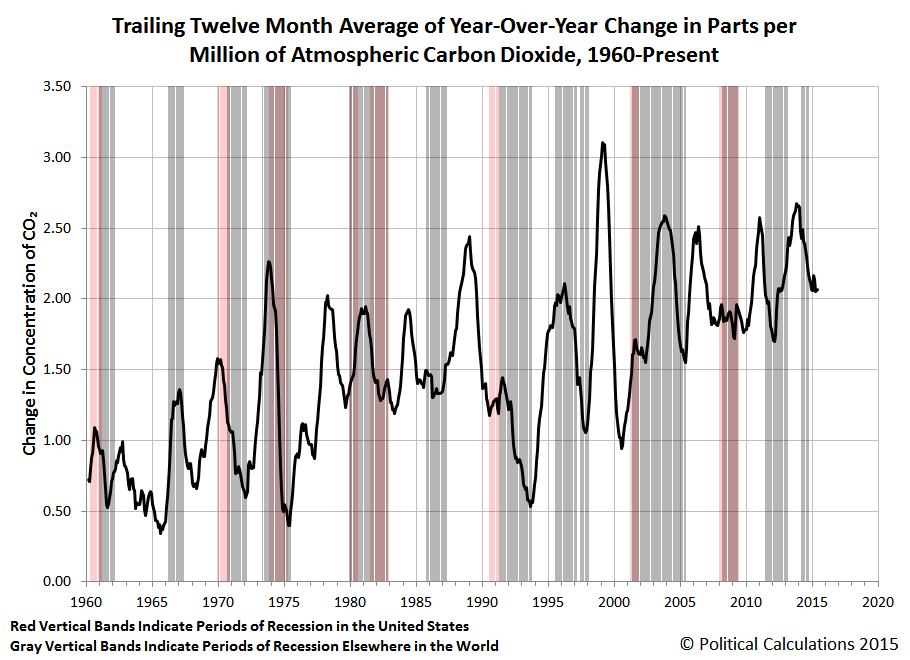
Earlier this year, we introduced a global economic indicator based on the trailing twelve month average of the year-over-year change in the amount of carbon dioxide measured in the Earth’s atmosphere, where we correlated changes in that level with the incidence of recessions in the U.S. and elsewhere in the world. Here is what we noted at the time:
The amazing thing that we see coming out of this juxtaposition is that it would appear that the trailing twelve month average of year over year changes in carbon dioxide levels in the Earth’s atmosphere would appear to be somewhat well correlated, in real time, with the incidence of recessions in the U.S. economy, which we see in either a falling or flat level of increase in CO2 in the Earth’s atmosphere.
That makes sense in that a contracting economy is likely to reduce its energy consumption which, in our largely fossil fueled world, produces a negative change in the amount of carbon dioxide in the Earth’s atmosphere. Meanwhile, a growing economy is likely to produce a positive change in the measured amount of carbon dioxide.
Here’s where things stand through the end of May 2015:
We’ve added the vertical gray-shaded bands to indicate where nations other than the U.S. have experienced recessions. That data is based in part on the OECD-Based Recession Indicators for OECD-member and non-member economies, which unfortunately, do not provide a good indication of the scope or severity of the recessions indicated.
As a general rule of thumb for using this measure then, we would consider the global economy to be expanding when the pace at which atmospheric CO2 is increasing and for it to be either contracting or experiencing recessionary conditions when it is respectively falling or holding level.
At present however, the trailing twelve month average of the year-over-year rate of change in the level of CO2 in the atmosphere is consistent with the falling or flat-pattern we observe during periods of recession on Earth.
Data Sources
National Oceanographic and Atmospheric Administration. Earth System Research Laboratory. Mauna Loa Observatory CO2 Data. [File Transfer Protocol Text File]. Accessed 11 June 2015.
National Bureau of Economic Research. U.S. Business Cycle Expansions and Contractions. [Excel Spreadsheet]. Accessed 11 June 2015.
Federal Reserve Economic Data. OECD-Based Recession Indicators for OECD and Non-member Economies from the Peak through the Trough. [Online Database]. Accessed 11 June 2015.
Updates
This post was updated at 2:53 PM EDT to add the text indicated in boldface font.
