Triggered by Tariffs, Shifting Expectations Send S&P 500 Sinking

It doesn't happen often, but sometimes, we find ourselves almost perfectly situated to capture two snapshots in time for the S&P 500 (Index: SPX).

We presented the first snapshot in time early in the morning of Monday, 13 May 2019, where we summed up what had happened to S&P 500 as it had been "knocked about by noisy U.S.-China trade negotiations" during the trading week ending on 10 May 2019 with just two charts and two paragraphs:

The S&P 500 (Index: SPX) set no new records during the week of trading ending on Friday, 10 May 2019, where stock prices mostly appeared to react to the noise generated by trade negotiations between the United States and China.

Alternative Futures - S&P 500 - 2019Q2 - Standard Model - Snapshot on 10 May 2019

Overall, the index stayed within the typical range of values our dividend futures-based model would project if investors were primarily focused on the distant future quarter of 2020-Q1. Not uncoincidentally, this period coincides with the expectation that the Fed will next act to cut its Federal Funds Rate during that quarter, according to the latest probabilities indicated by the CME Group’s Fedwatch Tool.

CME Group - Federal Funds Rate Change Probabilities Expected at Various Upcoming FOMC Meeting Dates - Snapshot on 10 May 2019

The second snapshot in time comes from the end of trading on Monday, 13 May 2019, when after having been triggered by China's new retaliatory tariffs, investors responded by shifting a portion of their forward-looking focus from 2020-Q1 back toward the nearer-term future of 2019-Q4 and the more negative expectations associated with that point of time in the future. For our dividend futures-based model of how stock prices work, that shift in how far forward investors are looking was sufficient to send the S&P 500 sinking.

Alternative Futures - S&P 500 - 2019Q2 - Standard Model - Snapshot on 13 May 2019

Having dropped below the range we would expect the S&P 500 to be if investors were focusing on 2020-Q1 in setting current day stock prices, or rather, the expectations for dividend growth that are associated with that distant future quarter, we would describe the current level of the S&P 500 as being consistent with investors splitting their attention between 2018-Q4 and 2020-Q1.

Not uncoincidentally, the sudden shift toward the earlier quarter of 2018-Q4 coincides with the heightened expectation that the Fed will next act to cut its Federal Funds Rate during that quarter, according to the latest probabilities indicated by the CME Group’s Fedwatch Tool. The following image shows how those probabilities have changed during the course of just one trading day:

CME Group - Federal Funds Rate Change Probabilities Expected at Various Upcoming FOMC Meeting Dates - Snapshot on 10 May 2019

As for why investors would suddenly be betting on the Fed cutting short term U.S. interest rates sooner rather than later, the Fed's minions have been priming their expectations for what they would do if the U.S.-China trade war slows the U.S. economy. Here's a sampling of relevant headlines since Thursday, 9 May 2019:

Now the question is will something happen to shift their attention back toward 2020-Q1 and prompt a rebound in stock prices? Or will they come to more closely focus upon 2019-Q4 and potentially send the S&P 500 down even more? If you can predict which point in time will come to capture the attention of today's investors and can set up your investing strategy accordingly, you could stand to benefit from what a behavioral finance expert like Robert Shiller might call irrational behavior, but which is really anything but.

Dividends by the Numbers for April 2018

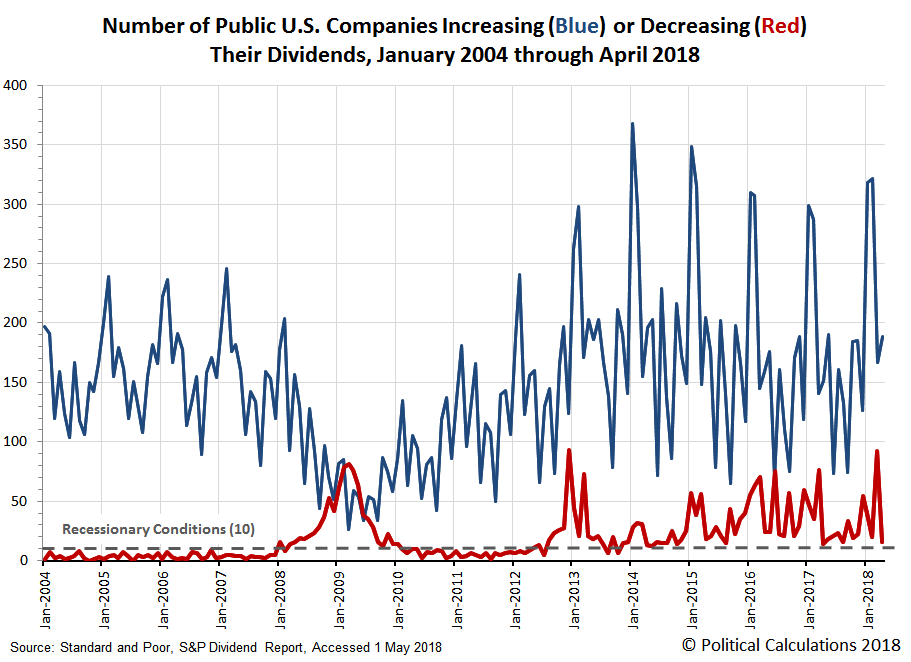
April 2018 saw the return of more normal dividend numbers where the quantity of U.S. firms increasing or decreasing their dividends was concerned, where Standard & Poor's topline numbers for the entire U.S. stock market had 189 firms announce that they were increasing their dividends and just 20 firms declare that they would either reduce their dividends or omit paying them during the month - far below the 101 firms that either cut or omitted paying their dividends as Standard and Poor reported for March 2018.

Number of Public U.S. Companies Increasing or Decreasing Dividends in Each Month from 
January 2004 through April 2018

It's a better picture than March 2018 was, so let's get to the metadata for dividends in April 2018!

  • There were 3,388 U.S. firms that issued some kind of declaration regarding their dividends in April 2018, which is down from the previous month's 4,392. It is also down year-over-year from April 2017's 4,017.
  • In March 2018, there were 34 U.S. firms that announced that they would pay an extra, or special, dividend. That figure is down from the 36 firms that paid special dividends in March 2018, but up from the 27 that paid out an extra dividend in April 2017.
  • We already touched on this number, but there were 189 U.S. companies that announced that they would increase their dividends in April 2018. This figure is up from the 167 dividend hikes in March 2018, and is also up significantly from the 152 firms that boosted their dividends back in April 2017.
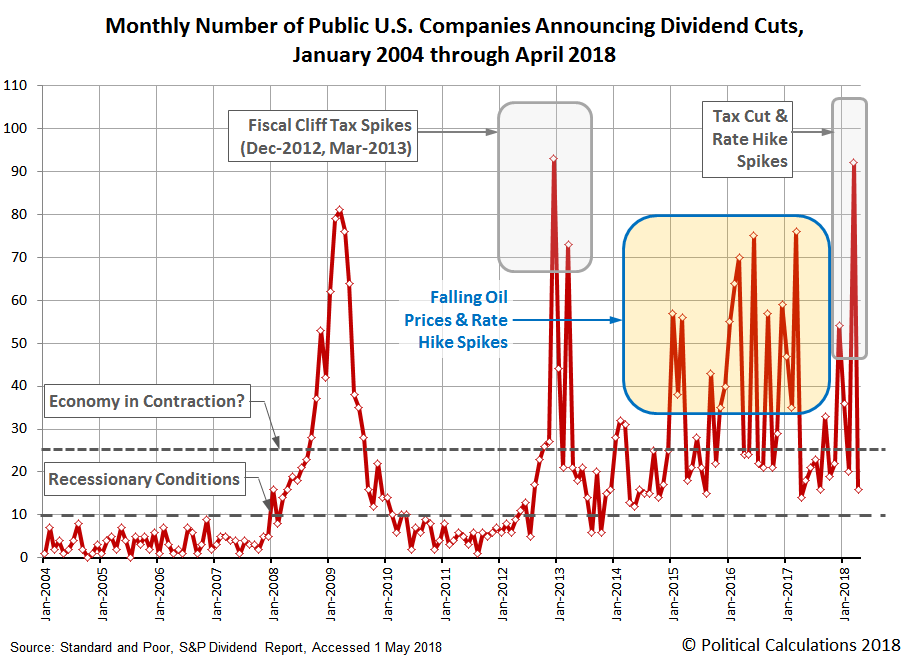
  • There were only 16 dividend cuts declared in April 2018, down dramatcially from the 92 dividend cuts that S&P reported for March 2018. Compared to April 2017 however, this number is a small increase over the 14 dividend cut announcements that were recorded in the same month a year ago.
  • Finally, there were 4 U.S. firm omitted paying dividends in April 2018, which is down from the 9 that omitted paying dividends in March 2018, but also up from the 2 that omitted paying dividends in the same month a year earlier.

The next chart focuses more closely on the monthly data for dividend cuts, where we confirm that the number of decreases plunged from March 2018's near-record monthly total.

Number of Public U.S. Companies Decreasing Dividends in Each Month from 
January 2004 through April 2018

Here's the full sample of 12 of the 16 dividend cutting firms from April 2018 that were identified as such by our near real-time sources for dividend declarations:

We find that the list of dividend cutting firms for April 2018 is predominantly made up of firms from the oil and gas industry, the financial sector and also a handful of Real Estate Investment Trusts (REITs). Among the oil and gas industry firms, we note a high number of Master Limited Partnerships (MLPs), which were recently negatively impacted by a change in U.S. tax regulations, which would prompt many to cut their dividends. Otherwise, much of what we see is the result of the typical month-to-month noise in the oil trusts that pay out monthly dividend distributions.

For the finance and REIT sector, we recognize that a lot of these firms are sensitive to interest rate changes, where the Federal Reserve's recent series of rate hikes is negatively impacting their ability to continue paying dividends at their previous levels.

There's also a single firm from the food industry, Paradise (OTC: PARF), which is perhaps best known as a candied fruit maker (the kind that is baked into fruitcakes), but which also manufactures molded plastic containers. We don't view this particular dividend cut as indicating any kind of trend for the fruitcake industrial complex.

Data Sources

Standard and Poor. S&P Market Attributes Web File. [Excel Spreadsheet]. Accessed 1 May 2018.

Seeking Alpha Market Currents. Filtered for Dividends. [Online Database]. Accessed 1 May 2018.

Wall Street Journal. Dividend Declarations. [Online Database]. Accessed Accessed 1 May 2018.


A Visual Guide to U.S. Income Inequality Measurements

What are the differences between the Congressional Budget Office's estimates of income inequality among U.S. households and the annual estimates produced by the U.S. Census Bureau? We've taken a stab at answering that question in a visual format throug...

Pace of Dividend Cuts Slows Near End of 2017-Q3

The pace of dividend cuts in 2017-Q3 has decelerated from what we were observing a month ago, where suddenly, 2017-Q3 is perhaps shaping up to be the best quarter to date in 2017. The following chart compares where the cumulative number of dividend cu...

Shift in Expectations Boosts S&P 500 in Week 2 of September 2017

U.S. stock prices during the second week of September 2017 were largely driven by two news events:

  1. Actual damage from Hurricane Irma in Florida proved to be considerably less than had been projected.
  2. Inflation data put rate hikes back onto the Federal Reserve's table in the near future.

By "near future", the likelihood that the Fed would next hike short term U.S. interest rates went from last week's zero percent chance of happening anytime soon to a greater than 50% probability that they will act to make it happen in December 2017, where the CME Group's FedWatch Tool indicates that the market expects no change in rates to be announced at the Fed's meeting this week.


Probabilities for Target Federal Funds Rate at Selected Upcoming Fed Meeting Dates (CME FedWatch on 15 September 2017)
FOMC Meeting Date     75-100 bps 100-125 bps 125-150 bps 150-175 bps 175-200 bps 200-225 bps
20-Sep-2017 (2017-Q3) 1.4% 98.6% 0.0% 0.0% 0.0% 0.0%
13-Dec-2017 (2017-Q4) 0.6% 41.6% 55.6% 2.2% 0.0% 0.0%
21-Mar-2018 (2018-Q1) 0.4% 31.7% 52.0% 15.0% 0.8% 0.0%
13-Jun-2018 (2018-Q2) 0.3% 22.6% 45.9% 25.6% 5.1% 0.3%

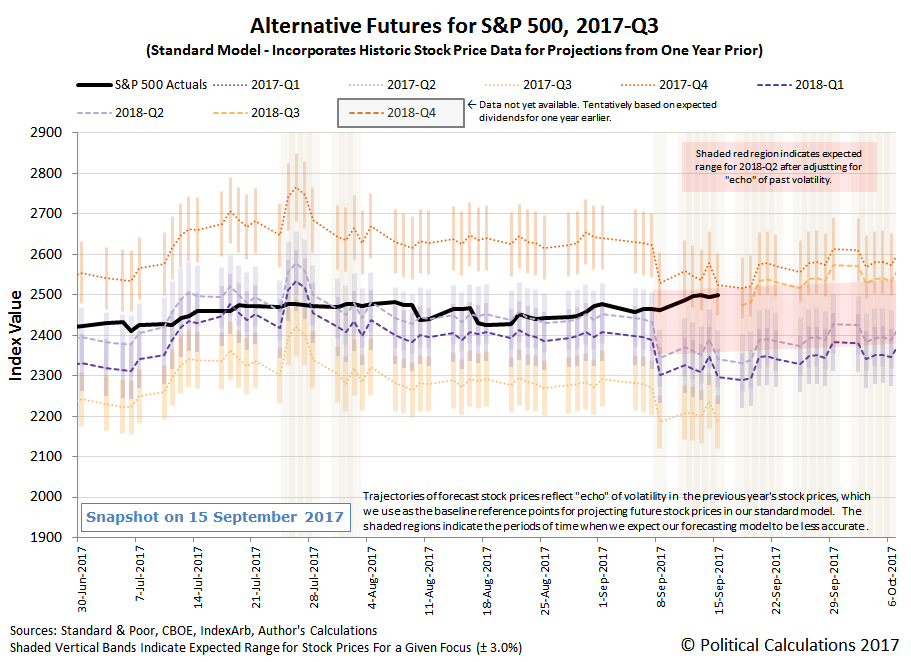
The effect of this new information on stock prices can be seen in our alternative futures "spaghetti" chart.

Alternative Futures - S&P 500 - 2017Q3 - Standard Model - Snapshot on 15 September 2017

With investors shifting their forward-looking focus from 2018-Q2 to 2017-Q4, the S&P 500 rose to reach a record high during Week 2 of September 2017, although right now, the data suggests that investors are splitting their attention between 2017-Q4 and 2018-Q2, where stock prices are reaching toward the very top of the echo effect-adjusted range we indicated for 2018-Q2 just last week.

The thing to pay attention to this week that might more fully cement investor focus onto 2017-Q4 is the statement that will be issued by the Federal Reserve's Federal Open Market Comittee at the conclusion of its upcoming meeting on Wednesday, 20 September 2017, as well as the statements of individual Fed officials in the following days.

Looking backwards, here are the more signficant market moving headlines that caught our attention during Week 2 of September 2017.

Monday, 11 September 2017
Tuesday, 12 September 2017
Wednesday, 13 September 2017
Thursday, 14 September 2017
Friday, 15 September 2017

Meanwhile, Barry Ritholtz succinctly summarized the positives and negatives for Week 2 of September 2017.